IntroductionCrystal Reports is a power reporting tool which ships with visual studio. It greatly enhances the process of creating reports. Crystal reports provide a Rapid Application Development style reporting model for both web and windows applications. Although creating reports with visual studio is a breeze, however; it takes some time and efforts to get acquainted with many of crystal report features. In this and following posts on crystal reports, we will have a look at these concepts to get a handle on crystal reports.
Crystal Reports integrate seamlessly with Visual Studio. Crystal reports works with ADO.NET, web services, flat files, MS Access and XML. We can easily export data from crystal reports to different formats including PDF, MS Word & Excel and Rich Text Format. The Crystal Reports API provides a rich programming model for creating and customizing reports. Before we dive into creating our first reports, following are some of concepts you should understand.Data Access ModelCrystal Reports can either use a Push or a Pull model to access data. In a pull model, the crystal report engine connects to the data source through a driver, executes SQL Commands against the data source and publishes the data on the report.
In a push model, the task of talking to the data source is left with the developer. The developer writes the code to hold the data in a data container such as a dataset, datatable or a custom collection and then later assigns it to the report. Use Page_Init MethodOn many of the forums, a problem commonly observed is that a report does not display properly when any of the button on the report toolbar (every report has a report toolbar at the top with different functionality) is clicked. Why this happens is due to a simple reason – Don’t use the Page_Load method. The data which binds and provides login information to a crystal report should always reside in the Page_Init method. Creating Crystal Report using Visual StudioCreating a crystal report with visual studio is straight forward. In this section, I will walk you through creating a crystal report for a web application. I will use a step-by-step approach for the readers. So lets get started:
1. Create a new a new web site in Visual Studio.
2. In the solution explorer, right click and click on Add New Item.
3. In the Add New Item Template, select Crystal Report. In the Name field, type NorthwindProductReport.rpt. Click Add.
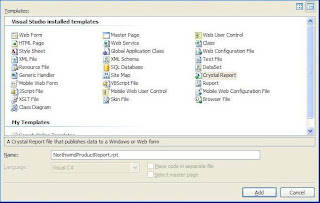
Fig 1
4. A new dialog box Crystal Reports Gallery appears. Select the Using the Report Wizard option under the Create New Crystal Report Document panel. Also select the Standard option under the Choose an Expert panel and click Ok.
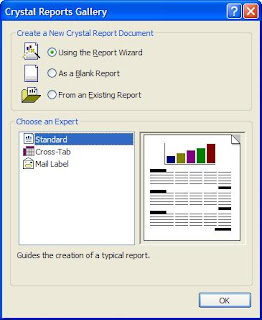
Fig 2
5. The Standard Report Creation Wizard dialog box appears. Under the Available Data Sources panel, expand the nodes Create New Connection and OLE DB (ADO).
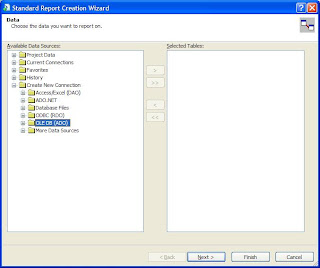
Fig 3
6. A new OLE DB (ADO) dialog appears. Under the Provider panel, select Microsoft OLE DB Provider for SQL Server. Click Next.
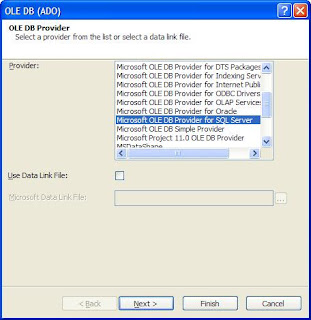
Fig 4
7. Under the Connection Information panel, enter in the Server, User ID, Password fields. Select Northwind Database. Click Finish.
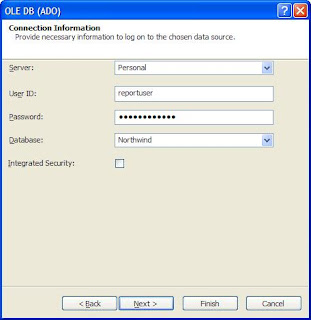
Fig 5
8. You return to the Standard Report Creation Wizard dialog. The OLE DB (ADO) has a new connection to the Northwind database. Expand the Northwind, dbo, Tables and select Products. Click the > symbol to move the Products table to the Selected Tables panel. Click Next.
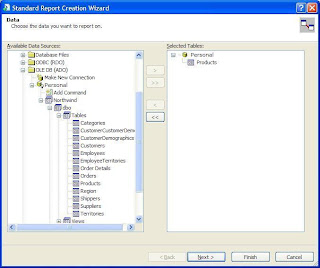
Fig 6
9. Under Fields and Available Fields panels, expand the node Products. Select ProductID, ProductName, QuantityPerUnit and Unit Price by holding the Ctrl Key. Click the > symbol to move these fields to the Fields to Display panel. Click Next.
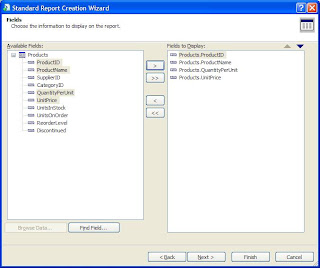
Fig 7
10. Under Grouping and Available Fields panels select the Products.ProductID field and click the > symbol to move the field to the Group By panel (Note: The Grouping function is similar to Group By clause in SQL Server. If there are multiple records for a grouping field, they are grouped together e.g. we can group Orders by Customers in a report). Click Finish.
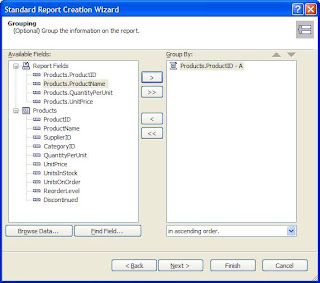
Fig 8
11. The report is created with four fields on it. You can change its properties by right clicking on it and selecting Format Object. You an also add different objects on this report including a line, box and custom text to layout the report.
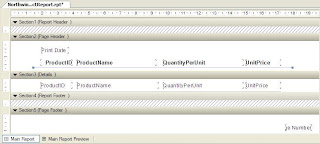
Fig 9
12. At the bottom of the report, you will find two tabs Main Report and Main Report Preview. Click on Main Report Preview to preview the report.
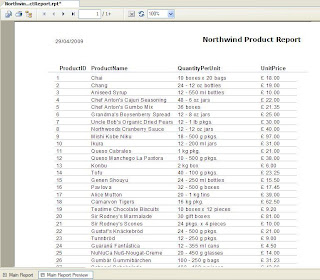
Fig 10
13. Now that we have created that report, we can easily embed it in a web page using minimal code. For this purpose, right click on solution explorer and click on Add New Item. In the Templates view, select Web Form and type Products in the Name field. Click Add.
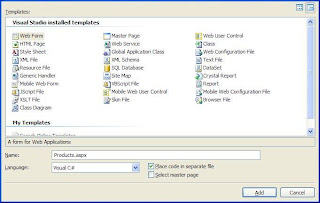
Fig 11
14. On the web form, drag an instance of CrystalReportViewer from the Toolbox -> Reporting.
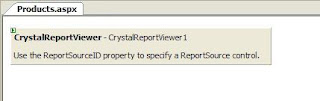
Fig 12
15. In Code View, declare Page_Init method as in listing 1: Listing 1
protected void Page_Init(object sender, EventArgs e)
{
    BuildReport ();
}
Next code the private BuildReport method described in listing 2 used in the above code: Listing 2
private void BuildReport ()
{
    ConnectionInfo connInfo = new ConnectionInfo ();

    connInfo.ServerName     = "Personal";
    connInfo.DatabaseName   = "Northwind";
    connInfo.UserID         = "reportuser";
    connInfo.Password       = "secretlogin";

    CrystalReportViewer1.ReportSource = Server.MapPath ("NorthwindProductReport.rpt");
    ReportLogon (connInfo);
    ReportLogon (connInfo);
}
Finally, the above code calls the method ReportLogon described in listing 3: Listing 3
private void ReportLogon (ConnectionInfo connectionInfo)
{
    TableLogOnInfos tableLogOnInfos = CrystalReportViewer1.LogOnInfo;

    foreach (TableLogOnInfo tableLogOnInfo in tableLogOnInfos)
    {
        tableLogOnInfo.ConnectionInfo = connectionInfo;
    }
}
16. Now if you run the application, you will see a report displayed as following:
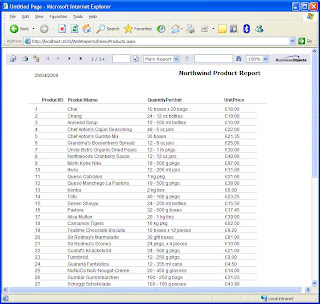
Fig 13
SummaryIn this post, I walked you through creating a simple crystal report. This is just the tip of the iceberg. There is so much more to be done with crystal reports. In my following posts, I will touch on different topics relating to crystal reports. Some of them will be walkthroughs while others will be tips to help you write better crystal reports. So stay tuned for more…


